
Project
GTM Reverse Engineering
Why is this tool growing so fast? Every analysis answers the same question — with sourced drivers, a 12-axis fingerprint and a playbook you can copy.
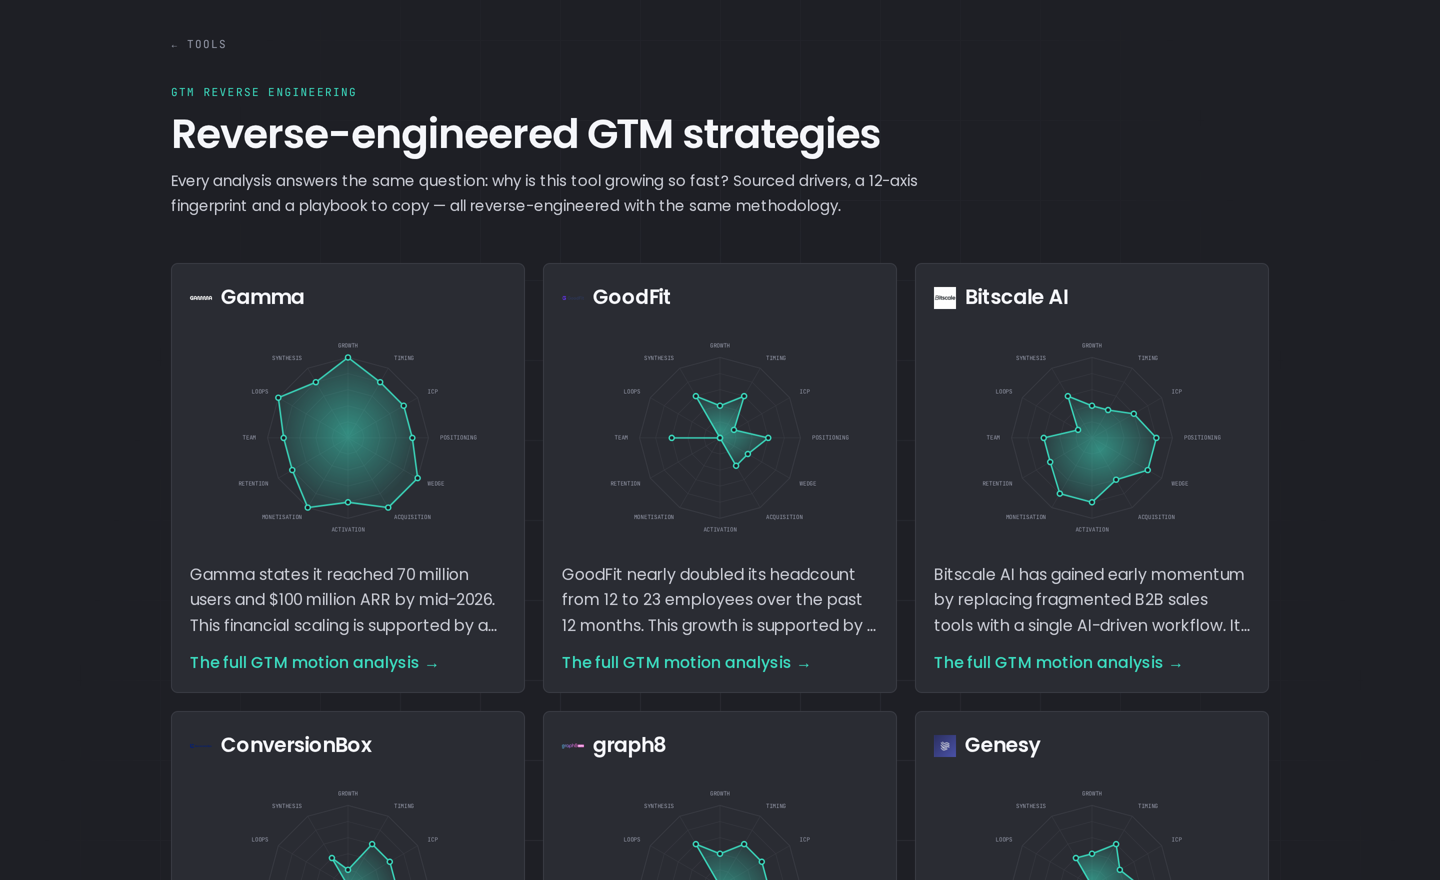
B2B growth stories are usually told, not evidenced. This project flips the direction: instead of an opinion about a tool, it starts with public evidence — headcount curves, pricing models, positioning, funding, content and product signals.
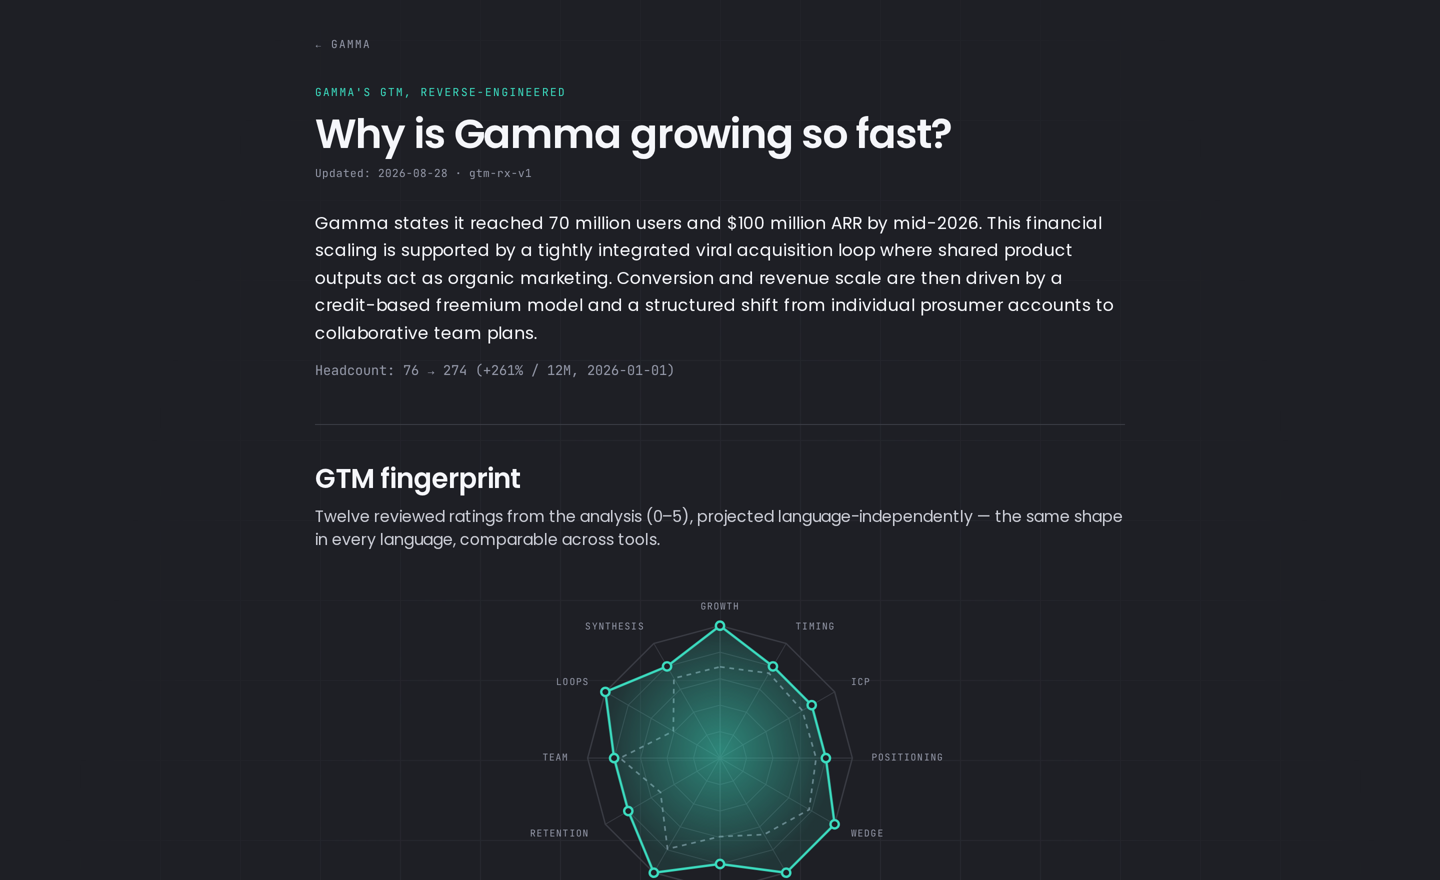
Every tool then gets the same structure: growth drivers with a source, a GTM fingerprint across twelve axes, and the motion behind it. Because all analyses follow one methodology, they are comparable with each other — that is the actual value.
The analyses live inside the tool directory: each tool has a profile page, and the matching GTM analysis sits on top of it. One project, two layers — directory and research.
How an analysis is built
Collect evidence
Public sources, headcount time series, pricing pages, funding and product signals — every claim sourced.
Isolate the drivers
What actually explains the growth: wedge, loop, monetisation or timing? Everything else is dropped.
Score the fingerprint
Twelve axes from growth to synthesis, rated 0–5, projected language-independently and comparable across tools.
Derive the playbook
What can be copied into your own GTM — and what only works in that specific context?
Who it helps
- GTM teams looking for patterns instead of anecdotes
- Founders who need reference points before picking a motion
- Investors and operators who want to test growth claims
See the analyses
All analyses are openly accessible and expanded continuously.