Databox
Problem: Scattered data and slow reports. Solution: No-code live dashboards with 130+ integrations and AI insights. Result: Faster, team-wide decisions.
databox.com/ ↗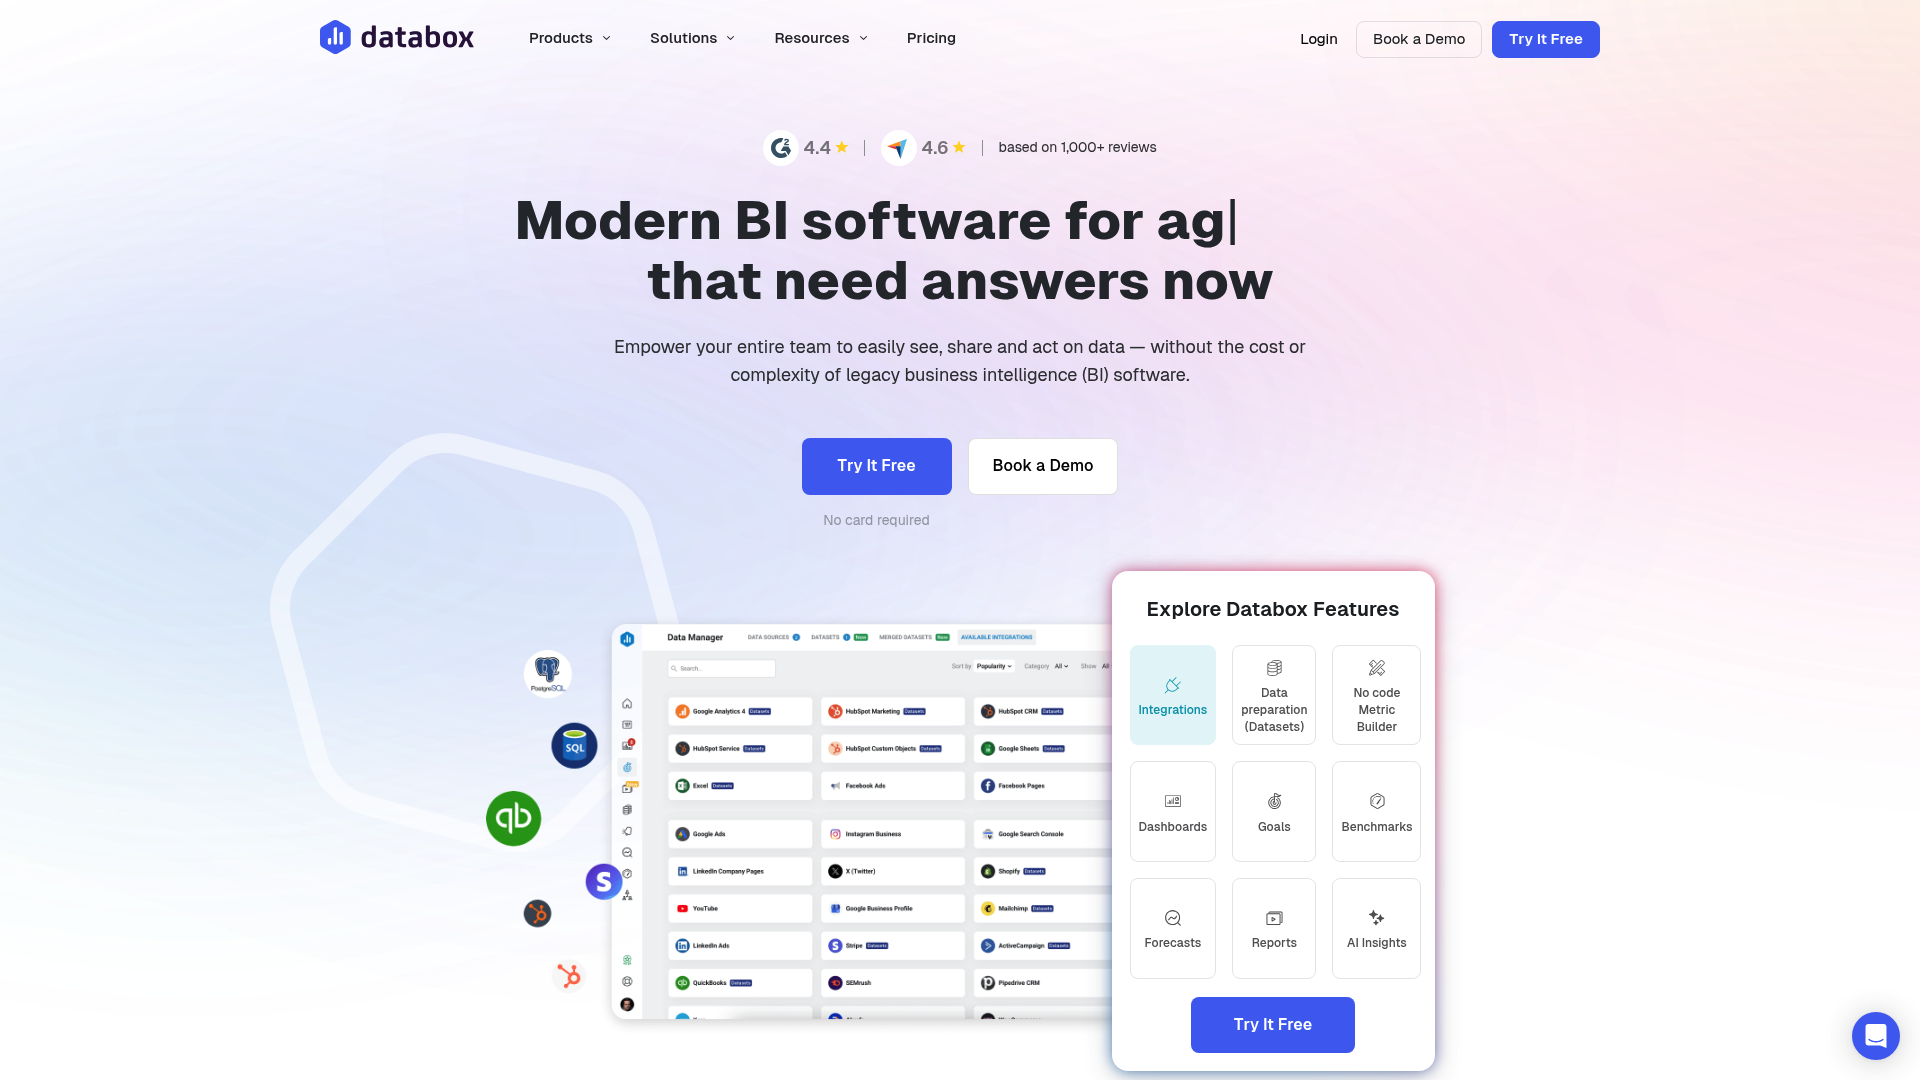
Databox Review 2026: The Ultimate KPI Dashboard Solution for Agencies and Teams?
TL;DR Summary
Unique Feature Rating & Criticism Ideal for Over 130 native integrations & one-click dashboards. 4.6/5 stars. Praised for speed; criticized for advanced pricing tiers. Marketing agencies and SMEs that need fast KPI visualization.
Introduction & Conclusion
Databox remains one of the leading cloud-based business intelligence platforms for teams that value speed and ease of use in 2026. While heavyweights like Power BI offer deeper analysis, Databox scores points with its extremely short learning curve and seamless data consolidation. It's the ideal choice for anyone who wants to create meaningful reports in minutes without any programming knowledge.
Databox's Core Features
1. Intuitive Dashboard Creation
With the drag-and-drop editor and over 130 connectors, data from sources like Google Analytics, HubSpot, and Salesforce can be easily combined. The platform promises that the first dashboard will be ready to use in less than five minutes.
2. Automated Reporting & Alerts
Users can set thresholds for KPIs and receive instant notifications via Slack or email when targets are met or missed. This enables proactive action instead of reactive analysis.
3. Unlimited users in paid plans
One unique selling point is that Databox does not charge per seat fees in its paid plans, which significantly simplifies scaling within agencies.
Real user experiences: pros and cons
3 Positive user testimonials
- Excellent support: Many users praise the responsiveness. A reviewer on Trustpilot (Sept. 2025) emphasized: "The agents resolve all my questions immediately! Thank you!" Simple visualization: On GetApp, users highlight how easy it is to consolidate data from multiple sources and create attractive, automated reports. High value of the free version: Smaller teams appreciate the functional free version, which provides a solid entry point into KPI tracking. 3 Negative user reviews: Difficulties with refunds: A critical review on Trustpilot describes the refund process as cumbersome and not very customer-oriented after dissatisfaction with the software. Technical performance fluctuations: Some G2 users Reports of occasional data synchronization delays and slow loading times for complex dashboards. Advanced Pricing: Criticism is often leveled at the "feature gating" strategy; advanced features and more data sources quickly lead to significantly higher monthly costs. Price-Performance Analysis & Competition: Compared to Tableau or Looker, Databox is much easier to use but offers less depth in statistical modeling. While Power BI dominates in the enterprise sector, Databox remains the favorite for client-facing reports in agencies. Pricing is competitive as long as you stay within the standard metrics.
At a glance
- Industry
- TechnologyInformation and Internet
- Competitors
- KlipfolioGeckoboardTableau
- Customers
- Evenbound, DispatchTrack, Conair
- Employees
- 134
- Followers
- 10,994
News & updates
In 2023, Databox published a comprehensive report showing the results of a survey involving 314 companies worldwide. The findings emphasize significant trends in business reporting, highlighting the critical nature of data analytics in shaping effective business strategies. The report identifies top metrics and tools utilized by businesses, underlining the company's commitment to enhancing insight and performance monitoring for its clients.
Company
Modern BI for teams that need answers now. It offers the best of Business Intelligence, without the complicated setup, steep price, or long learning curve. Our mission is to make it easy for every team at growing businesses to leverage data to improve performance faster. We’re always looking for goal-oriented, committed, and curious team players. If you're excited about building game-changing products that shape the world, where data informs every business decision, we'd love to meet you!
LinkedIn ↗